I’m seeing some strange information on the floathub site. I installed a floathub about a week ago. The floathub website indicated that my bilge pump hadn’t ran during the week which was not entirely surprising.
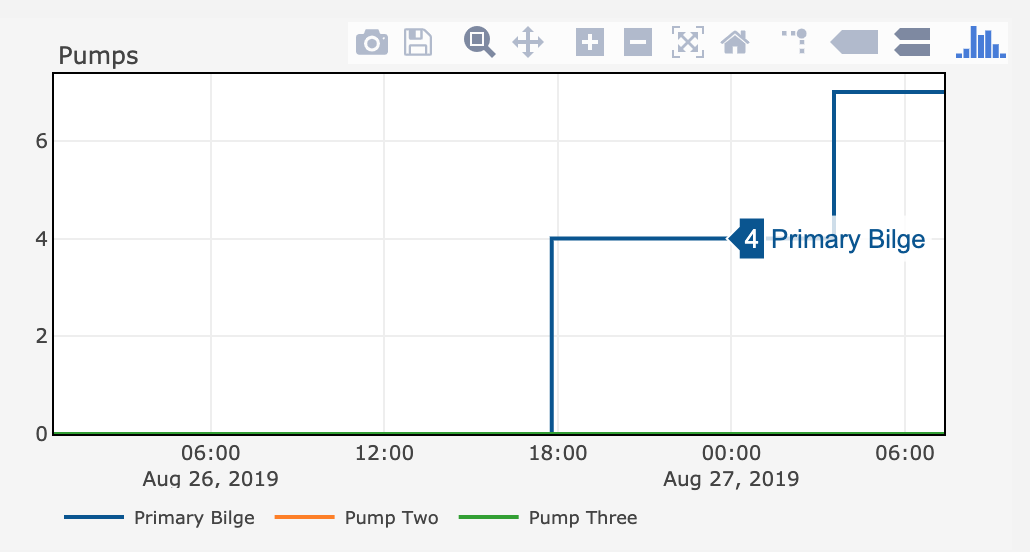
When I got to my boat this morning around 8am, as a test, I decided to dump a bucket of water into my bilge. The Wifi in the marina isn’t the best so the website didn’t update until about 9:30. But when it did the graph of bilge pump activity indicated that the bilge pump had run for 1.5B (Billion?) seconds:

It ran for about 5 seconds at the first go and then a couple more times as wakes hit us.
But the site is also saying that no pump activation has occurred:

Nor is my bilge pump alert being triggered (I set the alert to very low to provide another indicator) although the pump has run for more than the threshold.
This is almost certainly related to some of our recent interface changes. Many thanks for bringing to our attention, we will dig into this a little and come back with more details shortly.
We have a handle on this; your device was sending pump data with no GPS fix, which means it did not have an accurate time fix (i.e. no way to accurately time stamp the on and off times of your pump). In those cases, the system is meant to fall back on the timestamp of when the message was received. This is not working properly with the new interface changes. We should have it resolved in a day or so and will update again.
Ok, we believe this is resolved. This was indeed a case of assembling the underlying pump data but not properly catching the case where there were both 1) no accurate time stamps, and 2) out of sequence data (e.g. a pump off record followed by another pump off record without an intervening pump on record).
Of course let us know if you see any further odd behavior.
Thank you so much for your prompt response! I’ll definitely test a bit more when I am next aboard.
At the moment, however, my pump chart has disappeared entirely:
Ok, we should now have a fix for the fix in place 
Sorry for any confusion, and do please let us know if anything else is acting up.
The pump chart is back but the numbers don’t make much sense:

And now the email alerts are odd as well:
We have someone on that, will update you shortly.
Will send you a (private) email shortly as it contains some vessel data.
This morning’s graph makes a lot more sense:
I verified the voltage when the pump is running is 12+ volts. I verified this is the case when the pump is activated via the manual switch and the float switch. I verified than when it is not running the voltage is 0 (when I use the normal 20V range I use for boat measurements). I got a 5.? millivolt measure on the most precise measurement of my multimeter (it registers 100-200 millivolts if I pinch the leads with my fingers.
I switched the pump sensing lead from pump 1 to pump 2.
I’m at the boat for a bit longer, any further suggestions?
No, that’s perfect. Let’s leave it like that for a while. Will iron out of there is something flaky with the sensor or something more complicated going on with the WiFi always going in and out
This is pretty much what I did while testing today:
Two tests of the manual switch after switching the leads. Then as I was prepping my previous update I did two more taps of the manual switch and then dumped a bucket of water in the bilge to verify the manual and float switch “pump on” voltages matched.
Looks good so far … but let’s see what happens over some time with WiFi coverage going in and out.
Currently the graph of pumps one and two looks good:

But I keep getting the following alert (now that I switched my pump alert to pump 2):
FloatHub Alert (Counterpoint): Pump Two ran 12860 seconds, which is greater than target of 10 seconds (September 03 2019 - 17:18:05 UTC).
Yup, we were just watching that (we are temporarily getting a copy of your alerts as well).
The graphing code is newer than the alert code, and is better at throwing out illogical sequences (e.g. pump off with no preceding pump on). We are going to update the alerting code to match, but want to keep spending some time first carefully sequencing out your data arrivals. We’ve never seen this behaviour before, and other than the fact that it seems to be related to very challenging network connectivity, we don’t really understand why we are seeing this pattern.
Thanks again for the changes over the weekend, and we will keep you posted.
Oh, almost forgot, you can suppress getting endless alerts on this my going into:
https://floathub.com/alerts
Selecting your pump alert (Edit), click the Details arrow, and adjusting the “DO NOT” alert again setting to something like 1 day (believe it is currently 10 minutes).
The graphing code was doing really good right up till now. Not sure what, if anything, changed to throw it off again.
Yeah, this is similar to the previous behaviour, where there are a bunch of off signals that have no GPS timestamp on them:
+---------------------+---------------------+------+-------+
| received_time_utc   | time_utc            | pump | state |
+---------------------+---------------------+------+-------+
| 2019-09-14 15:49:08 | 2019-09-14 00:21:26 |    2 |     0 |
| 2019-09-14 15:49:05 | 2019-09-14 00:21:23 |    2 |     1 |
| 2019-09-14 15:46:23 | NULL                |    2 |     0 |
| 2019-09-14 15:41:56 | NULL                |    2 |     0 |
| 2019-09-14 15:36:50 | NULL                |    2 |     0 |
| 2019-09-14 15:34:30 | NULL                |    2 |     0 |
| 2019-09-14 14:33:19 | NULL                |    2 |     0 |
| 2019-09-14 14:25:20 | NULL                |    2 |     0 |
| 2019-09-14 12:18:08 | NULL                |    2 |     0 |
| 2019-09-14 10:58:31 | 2019-09-13 12:52:46 |    2 |     0 |
| 2019-09-14 10:58:30 | 2019-09-13 12:52:44 |    2 |     1 |
| 2019-09-14 10:50:35 | NULL                |    2 |     0 |
| 2019-09-14 07:44:01 | NULL                |    2 |     0 |
| 2019-09-14 07:40:08 | NULL                |    2 |     0 |
| 2019-09-14 07:17:10 | NULL                |    2 |     0 |
| 2019-09-14 05:22:58 | 2019-09-13 07:41:53 |    2 |     0 |
| 2019-09-14 05:22:54 | 2019-09-13 07:41:51 |    2 |     1 |
| 2019-09-14 05:16:00 | NULL                |    2 |     0 |
| 2019-09-14 05:08:02 | NULL                |    2 |     0 |
| 2019-09-13 22:13:10 | 2019-09-13 02:30:18 |    2 |     0 |
| 2019-09-13 22:13:07 | 2019-09-13 02:30:16 |    2 |     1 |
| 2019-09-13 22:07:30 | NULL                |    2 |     0 |
| 2019-09-13 22:05:47 | 2019-09-13 00:34:51 |    2 |     0 |
| 2019-09-13 22:05:45 | 2019-09-13 00:34:49 |    2 |     1 |
| 2019-09-13 22:03:29 | NULL                |    2 |     0 |
| 2019-09-13 22:01:37 | NULL                |    2 |     0 |
| 2019-09-13 21:56:32 | NULL                |    2 |     0 |
| 2019-09-13 21:56:25 | NULL                |    2 |     0 |
| 2019-09-13 21:54:28 | NULL                |    2 |     0 |
| 2019-09-13 12:58:02 | NULL                |    2 |     0 |
| 2019-09-13 12:53:17 | NULL                |    2 |     0 |
| 2019-09-13 12:44:29 | NULL                |    2 |     0 |
| 2019-09-13 12:41:21 | NULL                |    2 |     0 |
| 2019-09-12 20:39:12 | 2019-09-12 15:47:33 |    2 |     0 |
| 2019-09-12 20:39:11 | 2019-09-12 15:47:31 |    2 |     1 |
We could make the problem go away by ignoring the non-timestamped ones, but we’d really like to nail down why this is occuring. Probably best if we just put the fix in place, but we are going to keep studying how we are getting repeated off signals. Current guess is that the spotty network coverage means that we receive the transmission but that the device does not see the acknowledgement coming back. So it thinks the message is not sent and tries to resend. But that should not have null timestamps on it.
We will update you within a few days about the current state of the fix, and sorry for how long this is taking to resolve.